Group 6 VA Project Proposal
Project Overview
Topic Selection & Introduction
With the given choices based on the VAST Challenge 2024 and CHINAVIS 2024 Data Visualisation Competition, the selected topic for this group project is Challenge I from the latter, titled「Data Analysis Inspires Wisdom」Time-Series Multivariate Education Data Visual Analytics Challenge. This topic was chosen due to the Project Group members’ contextual familiarity with the topic, as well as its alignment to the members’ learning interests in leveraging on key visual analytics tools, to explore and design data-driven solutions for seemingly complex problems.
The selected project is centred on the learning patterns of learners in a programming course conducted by NorthClass Education Training Institute. Fundamentally, the project’s raison d’etre is to provide actionable insights towards the institution’s endeavor to diagnose and analyze learners’ knowledge mastery levels, monitor the trends in their learning behaviors, identify and dissect potential factors that contribute to learning difficulties, and hence to derive feasible suggestions to adjust teaching strategies and course design.
To this end, data was collected from a select group of learners over a specified set of programming tasks over a particular learning period to facilitate the design and implementation of a Visual Analytics solution as a key outcome in this project.
Problem Statement & Requirements
From the Challenge, the key problem statement was to perform a comprehensive analysis of multiple datasets that describe various aspects of the learner’s profile, learning patterns and status, to derive key insights to enhance teaching strategies and course design.
Consequently the key requirements based on the 5 stipulated tasks in the challenge were as follows.
- Task 1: To provide a quantitative assessment of the learners’ knowledge mastery and identify weak links in their knowledge system, based on the multi-dimensional attributes such as answer scores and answer status in the learners’ log records of the learners’ question-answering behaviors.
- This would entail an analysis of the learners’ aggregate performance in their programming tasks (a.k.a. questions in the dataset), including measures of central tendency, or any notable patterns that can glean insights towards knowledge mastery and weaknesses from the given datasets
- Task 2: To design and present learners’ profiles, based on learners’ personalized learning behavior patterns (including peak answering hours, preferred question types, correct answering rates, etc.), and various other attributes and characteristics
- This would entail an analysis and profiling of of learners’ behaviours and attributes based on statistically significant patterns that are observed across the variables in the given datasets
- Task 3: To analyse and provide a visual representation of the relationship between learning modes and knowledge acquisition (learners’ ability to absorb, integrate, and apply knowledge)
- This would entail an analysis to uncover the various learning modes and the patterns and/or correlations that it may have with the learners’ performance in the questions from the given datasets
- Task 4: To analyse the difficulty level of questions and learner’s level of knowledge (which should mostly align) and also to identify ‘inappropriate questions’ that may not align to this relationship.
- This would entail an analysis and comparison between the learners’ performance in each question and the learners’ performance ranking, and hence to identify any potential outliers that violate the alignment of question difficulty and learner’s level of knowledge
- Task 5: To offer valuable recommendations to optimize question bank content settings and enhance the quality of teaching and learning, based on the outcomes of the aforementioned analysis of Tasks 1 to 4 above.
- This would entail deriving actionable recommendations based on the insights gleaned in the visual analytics of the datasets from tasks 1 to 4 above
The Dataset
The provided materials for the challenge include 3 datasets described below, as well as a separate document providing a more detailed description of the data and variables
- Dataset 1: Student Information - This comprises of 5 Cols, 1364 Rows, providing individualised demographic variables of the learners (a.k.a students) within the scope this project
- Dataset 2: Learning Subject Title Information - This comprises of 5 Cols, 44 Rows, providing variables of the questions from the programming tasks which are collated in the scope of this project
- Dataset 3: Class Submission Records - This comprises of multiple datasets, each with 10 Cols and various number of rows, providing supposedly the participating learners’ answering variables to the questions collated in the scope of this project
Approach
The broad approach for the project is shown in the figure below.
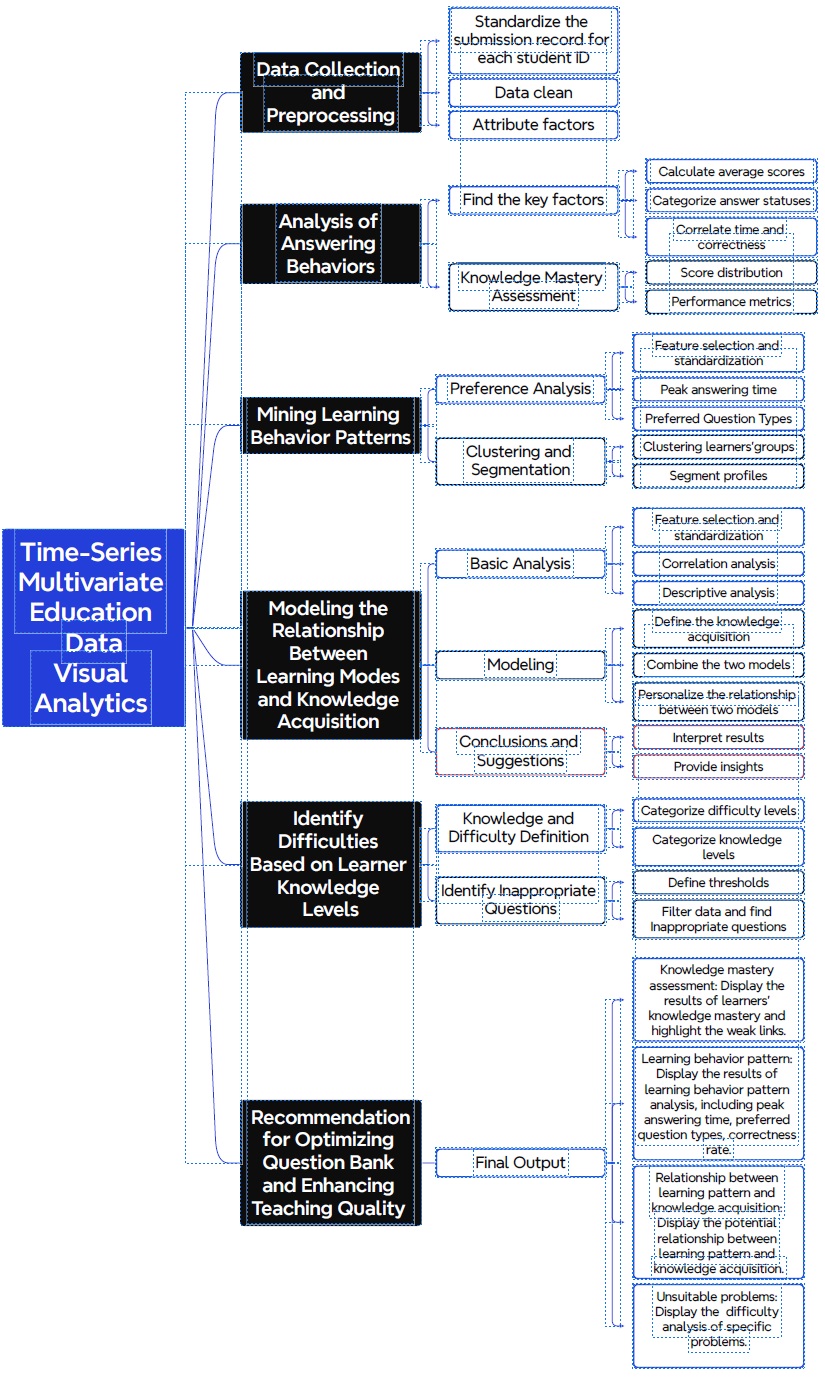
Methodology
Our methodology systematically integrates data collection, data processing, analysis, pattern mining, modeling, and recommendations to create a comprehensive Visual Analytics solution for improving teaching strategies and course designs at NorthClass Institute, elaborated below.
Key Data Preparation
Data preprocessing and cleaning is required at the initial phase to ensure usability and consistency of the data records for subsequent data analysis. Based on initial assessment of the datasets, the Key Data preparation steps required are as follows.
- Remove duplicates, handle missing values through imputation or deletion, and correct inconsistencies.
- Correcting data type and addressing out-liers.
- Create new relevant attributes if needed.
- Merging of Multiple datasets in Dataset 3 into a single continuous dataframe, and subsequently joining Datasets 1 and 2 with 3.
Key DataViz
To address the aforesaid requirements, the following methodologies will be considered for the data visualisation (DataViz).
- For task 1, the analysis of answering behaviors involves identifying key performance metrics such as average scores, answer correctness, and time correlations to evaluate learners’ understanding and application of knowledge. Descriptive statistics will be used to compute mean, median, and mode of scores for different topics and question types. Histograms, violin and box plots could be used to visualize score distributions. Performance metrics could be calculated such as accuracy rate, average attempts per question, and time efficiency. These statistical analysis and visualisations will be done in tandem with the classification of questions, to finally visualise and quantify mastery and weaknesses in the various knowledge areas.
- For task 2, learning behavior patterns involve analyzing habitual actions. Time-series analysis will be used to identify peak answering times. And by studying the frequency and performance of different question types with bar charts, the preferred question type can also be identified. To profile and segment the learner groups, clustering analysis algorithms like K-means or hierarchical clustering can be used based on features engineered from the aforementioned behavior patterns and preferences.
- For task 3, in modeling the relationship between knowledge acquisition and learning modes, feature selection may build upon analysis from task 1 for knowledge acquisition and task 2 for learning modes. Correlation and Association analysis can then be used to ascertain the statistical significance of the relationships if any.
- For task 4, to identify question difficulty and learner knowledge levels, questions and learners can be ranked and categorized based on the historical performance data, and thresholds can be defined to sort and bin the data into levels. Cross-comparison can thus be done to filter and analyze data to detect inappropriate questions that are too difficult based on learner performance. An alternative group of inappropriate questions can also be suggested through visualising questions that ‘weak’ learners scored better and/or questions that ‘strong’ learners scored worse.
- Last but not least for task 5, based on the insights gleaned, actionable recommendations will be derived, (such as optimizing the question bank, customizing knowledge delivery based on learning patterns and preferences) aiming to enhance the overall quality of teaching and learning.
Accordingly, a summary of the envisioned DataViz for this project will be as as follows.
- General Analysis (for Task 1):
- Bar plot for mean, median, and mode of scores for different topics and question types.
- Bar plot for classifying answers into correct and incorrect categories.
- Scatter plot for time vs. Correctness
- Facet plots to visualise multiple plots in a single space
- Score distribution and performance metrics (for Tasks 1 & 4):
- Histogram for score distribution, bar plot for accuracy rate
- Facet, Ridgeline or Raindrop plots for performance metrics and to compare distribution for various categories
- Peaking hours analysis (for Task 2):
- Time line chart: Displays the number of activities at different time points in a day to help identify peak hours.
- Heat map: Displays the distribution of daily or weekly activities to help discover high-frequency activities in a specific time period.
- Clustering result display (for Task 2 & 3):
- Radar chart: Displays multiple dimensional features of each cluster.
- Box plot: Displays the distribution of each cluster to understand the differences of clusters.
- Association and Correlation Analysis (for Task 3 & 4):
- Scatter plot with best-fit line/curve and shaded area for significance level using ggscaterstats for single numerical independent variable and dependent variable
- Multiple Violin plots using ggbetweenstats for multiple categorical independent variables and numerical independent variable